Total Pageviews

Monday, February 28, 2011

Expanding diagonal here

Wrong again in the counts. Its not like I have to change the whole count but just the smaller fractals . We are doing that 5th wave to complete the larger 3rd wave and this really looks like that rare Expanding DIAGONAL. We had a very good rally today . Only to give up the gains in what was the BIGGEST hourly sell-off I have ever seen ; to give up nearly 150 points in the NIFTY .


I have a feeling i have got this correct . One thing I read about Expanding Diagonals is that the vth wave travel faster and cover greater distance. So it really looks like we are headed down in a big way . My favourite target 5135 . Its the 161.8% of 1/A. Lets see. Thanks. 

Sunday, February 27, 2011

NIFTY Updates both LONG term and very SHORT TERM

I got two charts . One long term and one very short term. First the long term one . This is WolfeWave  which i saw recently. Bad news for Bulls. It looks like we are heading down in a big way . The target shows 3400-3600 area. Not sure about the time . But we are in a IMPULSIVE BEAR market .Remember that .See the chart below:


The other chart below is a very short term one . The 5 minute chart showing target for the next 2-3 days . While it definitely helps to know the log term trend  but this short term is really more important to us  because the options contracts are at most 3 months long and we really cant buy 3800 PUTs for next year and sit on our asses sipping beer. All investors must be TRADERS here.And make quick decisions. So lets see below .
In one of the post below " Pretty charts and FORECAST "  i had posted the same chart . I am adding one more thing , the WolfWave to it.


Things to watch here are the red lines and blue line. We came back after hitting that red lower line and that was also around 78.6% retracement of ( i ). So i consider it as ( ii ) .Now on Monday keep a look at these lines and point c particularly. Since elliot wave rules state that ( ii ) cannot retrace more than the origin of ( i ) .
The blue trend line also seems like its broken and we are starting the ( iii ). Finally we ave a WW pattern where the green line is showing target of around 5120 area.

Dont worry .We will not have to wait too long . It will be all clear by Monday, i.e tomorrow.
Thanks.

Saturday, February 26, 2011

Pretty Charts and FORECAST

More detailed chart. That 5232 point , if broken then down we go to 5100 area.


When we finish , we will complete wave 3 . Then start a little rally.

Forecast

Forecast.


Minute details

We should start the ( iii ) of the vth of the 5th of this bigger 3rd wave. 5 minute charts below. The trend line touched and down again.


Thanks.

Friday, February 25, 2011

NIFTY Updates

In one of the intra-day updates for NIFTY below , i said the maximum upside was 5339 which was the 38.2% retracement . Isnt it such a good feeling that exactly the same point will be touched by the retracing wave.

We are doing the 5th wave of this C ( 3rd ) and inside that we have now completed the ( 4 ) th . We are looking at 5 minute charts because its very important to know which wave you are in to be able to make good entry and exit points. After hitting that 38.2% retracement level it sharply turned downwards , only to retrace again . So i guess we have our ( i ) and ( ii ) of this ( 5 ) th wave . The chart is shown below .


That ( ii )  retracement was a strong retracement touching a little over 78.6% . So we can expect the ( iv )  to be a short retracement clocking around 23 to 38 % . But that we will see later. So now according to our count  we should be doing the DREADED  ( iii ) . So bulls should be heading for the BUNKERS on Monday . Most probably we will be completing the 5th wave ( i.e ( iii ) , ( iv ) and (v ) )  on Monday itself. That would also complete this C wave . That would mean we will be seeing a more than 150 points fall on MONDAY !!!!!  

This hourly chart shows where we actually did today's bounce . Exactly at the trend lines . That came at 5232.  If that breaks , the FALL would be hard.    


Lets see what happens on Monday . Thanks.

Thursday, February 24, 2011

Charts show target 5118

We may go down even below that . But the charts say minimum downside target 5118. The below is a 5 minute chart .


Short when that upper trend line is broken . 

NIFTY intraday UPDATE

We are doing ( iv ) th of this 5th wave inside a larger C (3rd ) wave. Lets look at the 5 minute chart .


Yesterday we completed the 3 with the BIG fall. Since 2 retraced exactly 61% of the 1st , we shouldnt see more than 39 % retracement of this 3 by the 4. That means maximum upside 5339. Dont know how far down we go. But 5118 looks like a good target .But we will definitely be having a very good rally may be by next week to 5600 area atleast .

Thanks.

SLV (Silver targets)

People are talking about Silver targeting $40 as well as $52 ----$56. In the long term those targets may be easily
surpassed. But for now not much Upside is seen . $36 may be a good area for shorting Silver. It may even go to $40. But targets for Silver is around $22----$25 area.

Both the charts below showing correction ahead. The sell zone however has not arrived.


Thanks.

Is it a bird ...is it a plane ...is it a drone ...or is it a Flying Mullah.....NOOOOOOO....its the stock markets ....LOOK at them CRASHHH

LOOK at the post below . Yesterday I told that we are doing the vth of this C wave . Yesterday we completed ( ii ) and had just started ( iii ). See the PLUNGE today. Absolute massacre .We opened GAP down and then no stopping. When the bears have their day even the best of the bulls are no match . Massive 545 points fall in BSE and 174 point fall in NSE. Dont worry . Bulls will have their day. But we still have a long way to fall.


5300 PUTS were selling for .60 paise today . At the end of the day it was 29 rupees!!!!!!!!! Lucky bastard whoever got that.

We will be filling that GAP on our way up.

But till then , happy shorting. Thanks.

Wednesday, February 23, 2011

NIFTY

Lets look at the Hourly charts .


So , according to our counts , the 4th of this C wave has already completed when we reversed from 5598 which retraced almost 61% of the the previous 3rd wave. So lets look at a short term chart .


So , we are inside the 5th wave . Inside that we have completed ( i ) and today ( ii ) . As that 5 min chart shows , ( ii ) was a diagonal triangle .After hitting that upper trend line it  came back strongly to break the lower trend line .  So now we will be doing that ( iii ) downwards. I expect Nifty to go down for some 2 days atleast breaking that important 5400 level support. The targets for this 5th wave is 4950 --5000 area.

Thanks. 


Next APPLE TARGET

Next target for Apple is 330 area shown by that ellipse .


Thanks

Tuesday, February 15, 2011

Downtime again

May be ....from tomorrow.......I guess all this rally was just because we had fallen TOO FAR TOO FAST.
May be NIFTY managed to break the trend line . But its already looking exhausted. And what more. The Technical Indicators are rolling over. Its not that pronounced in the daily charts but certainly in the 15 minute chart that I am going to paste it here. Note the GAP that we have to fill. So , does the 5 th wave starts here.


Shorting again for the next three days :).

Friday, February 11, 2011

Apple and NSEI

I dont know how much this would help. When i saw yesterdays flash crash in APPLE, and was looking at the 5 min charts , I thought the pattern was familiar. And it looked almost like................................. NIFTY 2008 .
You might want to go SHORT APPLE for the next 6 days.


Thanks.


iv wave ALMOST complete

See the chart below . On Monday expect the markets to slide along the red line . It hits the intersection of the PINK and RED line at around 5290. And then starts the BIG (v)th wave down to around 4880  in 3 - 4 days. LOAD up on your PUTS. 


Happy SHORTING.

Thanks.

Thursday, February 10, 2011

Updated Charts

The Master blogger from India has done some slight modifications to my chart. Lets see if this plays out.

 Also seeing some divergences appearing . Signs for a BUDGET rally???.


But the BIGGER picture is BEARISH . See that line going much below 5000. Thats where we are heading.

THERES NOTHING BULLISH ABOUT THE NIFTY

Please have a look at the below two charts . We haven't yet completed 3 of this C. We are set for (iv) and (v) . 4 and 5 are yet to come. Bearish Bearish.


This is the chance we bears had been  waiting for . SHORT THE SHIT OUT OF INDIA.

Thanks.


Tuesday, February 8, 2011

Pic


Shes NOT MY GIRLFRIEND.

FRACTALS

Even HnS are similar.  I am sure you will find more similar patterns of smaller degree.

Google mail

I had submitted application for Google Adsense.Was disappointed . This was the reply mail. I got rejected twice.
----------------------------------------------------------------------------------------------------------------

Hello JONAK DOWERAH,

Thank you for your interest in Google AdSense. Unfortunately, after
reviewing your application, we're unable to accept you into Google
AdSense at this time.

We did not approve your application for the reasons listed below.

Issues:

- Page type

---------------------

Further detail:

Page type: Your website is a type of website that we do not currently
accept into our program. Such websites include, but are not limited to,
chat sites, sites that drive traffic through cybersquatting, and sites
that use excessive keywords in the content or code of their pages.
---------------------

Now i have no idea why my small innocent blog cant have some ads placed on it. I know i cant earn thousands from it and I will never get 10000 hits in a day. But still it would have felt nice if I had some ads placed there.Still dont understand the reason . Can someone explain. 

Correction Time for Apple

I think its correction time for Apple and so the broader markets . Targets around 320-325. In 2-3 days. Its sounds wild but lets see.


Take your chances . Short it now.

MORE DOWNSIDE for NIFTY

You see that post just below. Well , I think we should forget about that Nifty 5450 target for a while now.See the chart below which is a 15 minute chart. I think 5028 is definitely on the cards. The patterns look so similar. The base of that falling wedge is around 5000. 5028 is the 261.8% extension of wave A.


I will keep on finding some more patterns. Keep SHORTING.

Hope for a rally

The NIFTY is looking more likely to touch 5200 or below. But we may get a rally before that in the coming 3 days for a target of 5450.


Sunday, February 6, 2011

Dow 13000 coming??

I found this chart somewhere. There wasn't much commentary along with it. Just that Printing billions can do a lot to BOOST sentiment. And with the FED Hawks already talking QE3 , we may really see it . But may be after a little correction now.


Saturday, February 5, 2011

Fibonacci

The Indian Markets had a huge down day on Friday and Nifty broke the Crucial 5400 level(on HUGE volumes). Monday will be very interesting. Egypt is building up . We shouldn't forget that important LEGATUS event (here:::---http://legatus.org/public/index.asp) . I had plenty of spare time , so i thought of working out the Fibonacci retracements and extensions for the current count we are looking at . Chart below :


[ ii ] retraces 23.6% of [ i ].

[ iii ] is 123.6% of [ i ].

[ iv ] retraces 38.2% of [ iii ].

[ v ] is 61.8% of [ i ].

A retraces 38.2% of the 5-wave impulse. A was a 5-wave motive wave forecasting a zig-zag. And it has been a zig-zag . B was a 3 wave corrective wave retracing 75.61% of A. C is already looking a huge downward moving wave.Usually C has targets 61.8% , or 100% or 161.8% of A. We have already crossed far below the first two distances. the 161.8% extension of A is 5135.But the again if we take 161.8% of I , we get to the target 5007 and 138.2% extension target is 5125. Looks like we are hitting these targets in 7-days .
One after another stop is being taken out with full force. Looks like its game over. 2008 all over again. This is what 2008 looked like. See the stocks started going down in January with a huge nearly 2000 point drop in the Nifty in 2 weeks at one point.


This again shows that NEWS don't move the markets. I have a hunch that 2011 is going to be worse.
Keep shorting.

Friday, February 4, 2011

Posts from INDIA

Record outflows from EMs:

http://economictimes.indiatimes.com/markets/global-markets/record-net-outflow-from-emerging-market-stocks-report/articleshow/7426586.cms

BIG EARTHQUAKE in my homestate:

http://www.rediff.com/news/report/northeast-india-rocked-by-quake-of-the-decade/20110204.htm

Assam had 2 of the BIGGEST earthquakes in HUMAN HISTORY. In 1897 and 1950. Both more than 8.5
After the 1950 one , floods became yearly phenomenon due to the changes to the BRAHMAPUTRA.


The US wants us to OPEN UP. I am pretty sure that it will not be for our good.

http://www.moneycontrol.com/news/economy/india-needs-to-openits-economy-gary-locke_519853.html


Govt has no magic lamp to control inflation :FM
http://www.moneycontrol.com/news/economy/govt-has-no-magic-lamp-to-control-inflation-fm_519847.html


Hes right . They cant do anything. Its all BERNANK.


More Pictures


The Indian Markets did what its supposed to do . Go down . A huge 441 move down in Sensex. Also Nifty broke the CRUCIAL 5400  level everyones been talking about. Nothing more to see there . More downmoves coming in the next few days. Just found some more funny pictures.


Housing in trouble everywhere.


My favourite:CALVIN EXPLAINS THE ECONOMY.


Heres the last one for the dismal jobs report.


Thanks.

Thursday, February 3, 2011

Wednesday, February 2, 2011

BIG COUNT

You can always count differently . The below is my PRIMARY. Its a B of an ABC . B's completed. So C starts now. And looking at the massive losses since start of the year , it really looks like we  are in a massive impulsive wave downward.


423% of [ 1 ] is 6384 . The Nifty TOPPED out at 6338. [ 4 ] is 38.2% of [ 3 ].


Tuesday, February 1, 2011

All Downhill from here

Lets look at the count that I am concentrating now where the uptrend had started back in May last year.


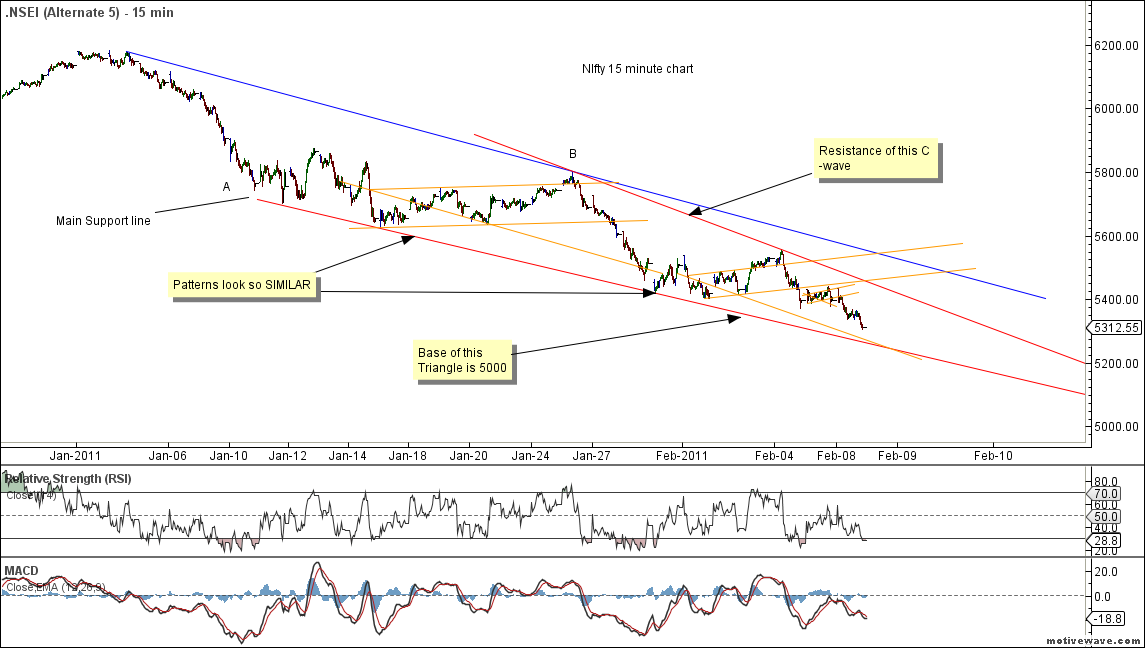
Going by that count we are in the 3 of a C wave here. 1 and 2 are shown and the parallel lines shows the retracement from 1 to 2 which was a little less than 23.6%. Then started the 3rd wave. My favorite for this 3rd wave is that 138.2% extension of 1 , i.e 5135. Yesterday we went as low as 5410 to retrace back to 5507 and then today we opened up and touched 5561 which is exactly 38.2% retracement from 5410 low. So we can count it as the 2nd wave of this 3rd wave. So looking for more downside in the coming 3 days at least.  Also it looks like a bearish engulfing pattern appeared today.The market is also much lower than its 200DMA for the first time since June last year.


Added a couple of other classic technical indicators as well. On the above chart we see that the MACD is clearly showing downtrend.  The ADX (green line) is clearly moving towards 40 . Shows that the downtrend is only growing stronger.The RSI is at 30 but i think it has lot of room to move downwards.Expecting to slide along the lower edge of the Bollinger Band in this downtrend. Looks like its 2008 all over again for the Indian markets . At that time too the correction had started in January.

Another important result fo today :RELIANCE INDUSTRIES. The biggest stock in the markets has broken 900 . Shocker for a lot of people.Lets take a look at its chart too. I have to tell you this . I had never seen this chart . It had been trading in a range since the last two years.!!!!!Since it went up from  the March 2009 low .
Looks like that break down of 900 is REALLY REALLY crucial.


All this is happening in spite of the dollar going down .The Indian markets were related inversely to the dollar at least to the A point. This is what happens to a market when its TIME IS UP. I cant even imagine what will happen if  we see a massive dollar rally some time later in the year. For now , the BEAR HAT is firmly placed on my head.

See you down hill. Thanks.