Total Pageviews

Wednesday, August 31, 2011

Nifty Pullback

The important short term oscillators are all overbought. I don think we have too much gas left in this upmove.
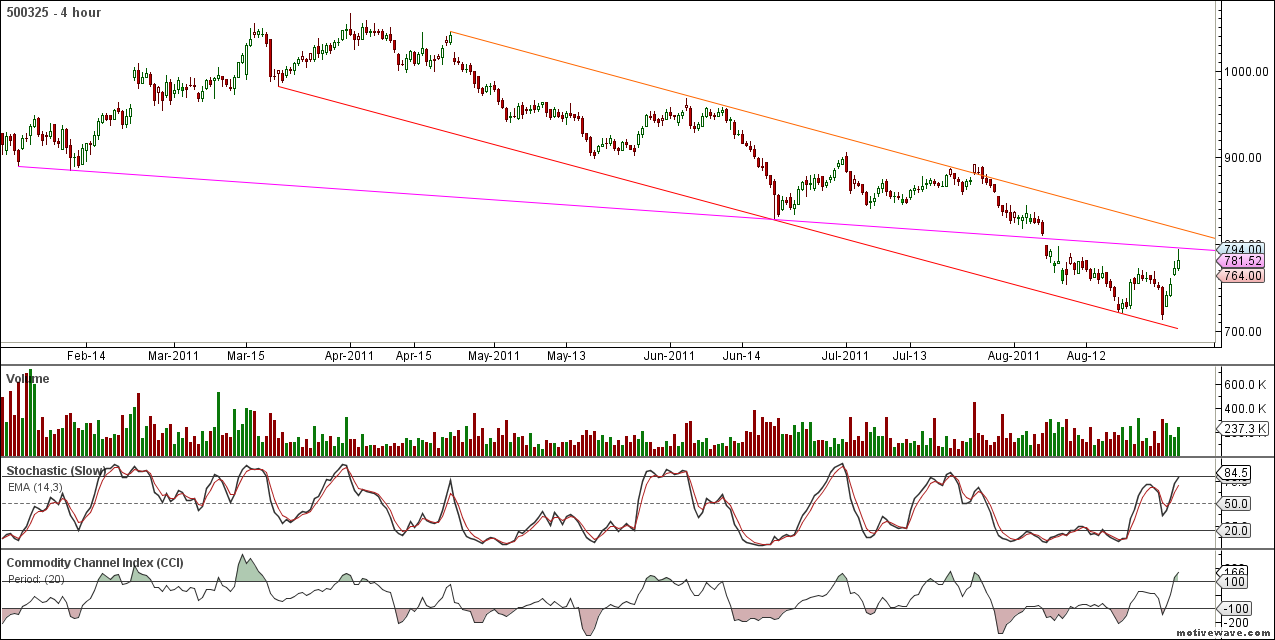
The daily chart below shows that the thick PINK channel line  should be hit and then we move down .


IN the line chart we find that we are able to draw fewer parallel channel lines  satisfactorily. In the chart below , we see that the orange line is certainly one of the the imporatnt line which has come into play a few times before. Thats the maximum i think Nifty will travel . If I draw green dashed line , the level is seen as 5070.


That should complete a of this (iv)th wave.

SnP 500 --elliot waves

One last 5th wave in this UPMOVE may be.


Tuesday, August 30, 2011

SnP 500

The SnP is hitting IMPORTANT resistance here. The BLUE dashed line.


Another chart. I think just a little bit of spike coming and we touch hat PARALLEL channel red line. That should come around 1230.


All technicals at overbought levels. No point going LONG now. We should come down shortly.

Reliance Charts

No point in holding this one . All it may manage is another strike at the pink line.It did today and came back strongly.


Sunday, August 28, 2011

Mphasis ---in troubled waters

MPHASIS, an HP Company, looks to be in trouble. Declining profits and revenues , conflicts with the parent company and global slowdown.  Shares have been in free fall. Chart below shows that the last close was below important level of 372. That was also the 61.8% retracement from the highs. If the RED trend line is taken out , the next support comes at 260 area, which looks more likely now .


INFLATION

What is it with the term "INFLATION"  and economist . They seem to simply love it. Here is Zero-hedge reporting that BERNANKE's speech in Jackson Hole mentions INFLATION 10 times ; DEFLATION and GOLD : zero(0).

http://www.zerohedge.com/news/word-cloud-trichets-disappointing-jackson-hole-speech-inflation-mentions-10-deflation-and-gold-

They love "INFLATION"  because they want the "ILLUSION" to keep going on.


Indeed, the vast majority of US economic growth over the last 40 years has been fueled by the Fed’s loose money policies. Bill King, an analyst and investor , posted the below chart a while back. It charts US GDP growth in nominal terms (the dark blue line), the performance of the Dow Jones Industrial Average (the black line), and REAL GDP growth or growth that accounts for inflation(the light blue line).


As you can see, when we account for inflation, the US economic “miracle” of the last 30 years is in fact not all that miraculous. Take away easy credit and Fed funny money and the US GDP has barely grown at all since the ’70s When your entire financial system is built on debt eventually you hit a brick wall.


They need the ILLUSION of growth and prosperity to be going so that they themselves could become so large till they now no longer care. Here's an example of their POWER.


http://www.pakalertpress.com/2009/03/16/six-jewish-companies-own-96-of-the-worlds-media/


I can easily bet that they own 90 % of MILITARY and INDUSTRIAL complex too besides ENTERTAINMENT.


So for all the science , growth , development, education , industries that were SHOVED DOWN OUR THROAT, saying that they were for our good, it seems we have been serving completely      different INTERESTS and PURPOSES . EDUCATION was simple preparation for corporate slavery. It has nothing to do with learning. 


 GLOBAL PONZI ECONOMY  is at the end of the road.


Nifty --More charts

Everyones wondering whether we will bounce from here or we get more selling before the bounce. I guess we will fall more but just a bit. We haven't really formed any reversal pattern or candlestick till now. First lets take a look at FIBO levels which are being obeyed in this fall. Chart below looks good. Here we can also see that the wedge support line hasnt been touched. The fibo levels has another good target at 4693.We will touch the lower red line by that level.


On the daily chart i have drawn a few parallel lines. These parallel lines have given fantastic entry and exit points. The thick ORANGE line below hasnt really been touched . I guess that will be done and then a reversal will happen . Not much to travel though.


I have been seeing in Nifty, that  the FALL ( or RALLY)  at various points of time have been EQUAL to FALLs ( or RALLIES ) at other points. So we try to match the current fall with the BIG fall we had at the beginning of the year.   Below we see the two FALLs marked by the green and red ellipses. According to that , both will be equal when the current FALL touched around 4690.

Friday, August 26, 2011

NIFTY Updates

Nifty is very weak and seeing massive sell-offs. Broken most major supports. Lets see where we stand now.
First the weekly charts . The indicators are way oversold and so I don't expect too much selling now. Chart below:

See that THICK RED line . That line is exactly parallel to that THICK Orange line above which was acting as major resistance.  The THICK PINK line was the lower support of the major channle that we broke some time back. The thick BLUE line is parrallel to that PINK line. I drew the BLUE line from a major PIVOT low.. SO the NIFTY stopped to day at the intersection of the 2 lines. We also see another DASHED orange line which is a major support. That actually comes around 4680-90 area. If that is broken , Nifty's next good support looks to be  3800.

On the daily chart we see that the parallel channel has been perfectly touched. But thats no guarantee it will not slide more.


Bigger chart shows that correction already reached 38.2% .


Looking at the shorter term chart, I tried to count the waves. It seems we have completed the (iii) and we are set for the (iv). According to this count , (iii) was exactly 423.6% of (i).SO according to this count , we go up to do the (iv) and than another wave down to (v).


I am not a fan of elliot waves but the fibo levels are playing well. If we bounce from this region I am not expecting more than 5000. But before that there is a chance we see one more sell-off to touch 4680.

Divergence are seen in some of the indicators . I just think its not time to be in markets.

Tuesday, August 9, 2011

NIFTY Updates

Nifty is finding it HARD to cross that 5197. That was the low from where we had that MASSIVE rally last time. That RED line needs to be crossed by the BULLS. It looks tough now for BULLs as shortterm IMPOTANT technicals already overbought. We should DOWN move soon enough. Thus down move might target 4862 or even 4771. Charts below.


The RED line , if taken out , will give faster FALL.


Monday, August 8, 2011

NIFTY Updates

We may head up very fast and we are right now. The expectation from FED for QE2.1 or QE 3 may turn around the markets temporarily. Lets see the targets . The below RED line may well be reached. Though its a bit too far. But anything can happen. 


Retracement levels from the last downtrend.


AT present Nifty is getting stalled at the 23.6% retracement 5090 level. 38.25 retracement is at 5177 and 50% is  at 5249. 

Friday, August 5, 2011

Nifty BROKEN MAJOR channel support line of the last 1 and half years today . That RED line has broken and when Nifty bounced off the lows today , it just managed to touched that broken support line and went down a bit. Although a HAMMER is formed i dont see any uptrend here .  I see 2 more down days for a target of 5000 area.

4970 is the best support i see.The levels and channel supports can be seen below:

the fibo levels are playing well. 2 good targets are 5031 and 4960. I see some good  bounce towards 5300 level only after that.

ELLIOT WAVES:: From whats going around it feels that we are going far lower than 4800. This is the count that I prefer


SnP 500

Major supports have been broken without any respect . If the GREEN line breaks around 1190...next support looks like 1130...the light blue dashed line.

As I write this , it looks it has been taken down.

Wednesday, August 3, 2011

Nifty

Even with the HUGE YEN intervention , markets are finding it tough to go up. I am short now. Target 5313 , 78.6% retrament of the upmove from 5190 to 5739. Another  retracement.target 5259 is 88.7%. It looks like 5 waves are still to be completed in this one.


SnP 500 breaks MAJOR TREND LINE SUPPORT

So the trend line support that everyone was watching is BROKEN decisively now. Below weekly charts show supports at the dashed lines at 1230 , 1210.


NIFTY Updates

I had a feeling last night that there was  one more down leg in this move. And we went down today . But now the most important technicals are oversold and divergence is there everywhere. A little rally is expected. We have two GAPs to close. One closes when Nifty reaches 5456 which is around 23.6% retracement of this fall from 5739. And the one closes at exactly 38.2% retracement of this fall from 5739 to where we are now, i.e 5516. RED Wolfe WAve is showing a target of 5550 area and 5559 is 50 % retracement . SO wee see that the FIBO lavels are playing perfectly here. . Lets see. One can enter longs now with least risk.


But the GLOBAL economy is so bad that STOP LOSSES are a MUST. ANything can happen now. Though technically i see a bounce, it may be just around 5460 and then another PLunge towards 5200 level. Be extremely carefull.

Tuesday, August 2, 2011

Dollar poised for a massive rally??

We know that the dollar will rally at some point of time . Its almost at the end of its fall. But a look at the charts tells that this rally could be MASSIVE.


Rally may target that THICK ORANGE line.

NIFTY Updates

Charts in all timeframes show OVERSOLD conditions .  Divergence appears in technicals in various timeframes. We see from the 90 minute chart below that the Nifty has HIT important trend line . Also a WOLFE WAVE can be seen . I see a rally from here on to hit that RED WW target.


A closer view of the WOLFE WAVE below :


Monday, August 1, 2011

SnP500 update

Today I have taken the EXTREME points reached in SnP 500 index and drew the lower trendline. Its at a very CRUCIAL STAGE. NExt support comes at 1230 level.