Total Pageviews

Monday, December 26, 2011

Nifty trade--The PLAN( update --5th Jan---Change of PLANs)

UPDATE :::3:30 PM -------SQUARE OFF ALL LONGS. AUD/USD has broken down . Next week we will see down move. Going  SHORT . Next week we might revisit 4520 area agin.
======================================================================================================
Update -5th Jan .

Hi everyone .  

The markets is  not as strong as I would have liked . The wolfe wave target shown by PINK LINE  given in the chart below should be met . But the question is HOW. It looks like we will go down first and then go for a rally . As we can see in the chart below , the upper level of BOLLINGER band has come down .Nifty wont cross that level without coming down . Both that level and the downward resistance line are showng that at most nifty can travel is 4850 area. We should be trying to reach that target , by tomorrow.

At which point we might GO SHORT .


=======================================================================================================
Nifty Plan update --2 Jan-2012

Weekly CHART below . Two good indicators the CCI(8) and stochastic(5) are in oversold zone. Dont see huge sell-off at this moment. Nifty has corrected around 90 more points than I expected.  The WOLFE WAVE line intersects the down trend resistance line at around 5280...So I think thats the maximum the Nifty can go . Also  Nifty has around 8 more trading days left  to touch that . Lets see what the market does.  Last year all the gains came in the 1st fortnight of January. After that Nifty has been crashing in SLOW MOTION. Also COMMERCIALS are NET LONG the EURO hugely . Seeing a squeeze there.

Another important thing is that January 10-11 is roughly 34 month from the MARCH 2009 low. So that should be significant time around there.  So lets hold on to the CALLs till that time or atleast till this week.


=============================================================================================

Update(28 dec--2:pm):-----Nifty should touch 4685 area. There we BUY January CALLs for a 1st target of 4930-4940.


=============================================================================================
I still believe we are going a lot higher than the current levels as I forecasted::---

http://markettechnicals-jonak.blogspot.com/2011/12/nifty-update.html

From pattern and symmetry it looks like we rally for 16 TRADING DAYS. I will post more on that later.  Now 4820-4830 is very good resistance . I expect Nifty to take a pause there. So we should see that level by tomorrow . Where I would SQUARE OFF the longs. Then I should take a small SHORT POSITION . I am thinking of a downmove to 4720 . And thereafter no more DECEMBER CONTRACTS. Expiry is very near.  By Thursday or Friday , I should be going  LONG JANUARY contracts.


Happy Trading.

Tuesday, December 20, 2011

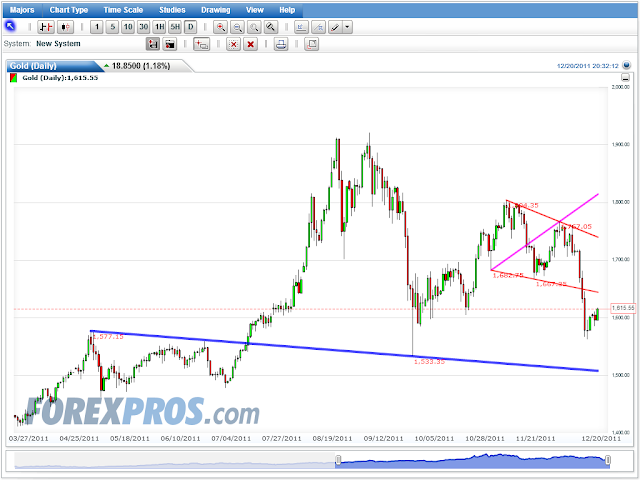
GOLD targets higher.

Check that PINK Wolfe Wave target line  in GOLD showing a target of atleast 1900 dollars. This surely is one of the few good buy opportunity.

Wednesday, December 14, 2011

Nifty ::Massive rally ahead

4650 area was the target i was looking for . Looks like the FALL is going to end on Monday, after breaking 4600. Target for me is 4570.

http://markettechnicals-jonak.blogspot.com/2011/12/nifty-short-opportunity.html


But after that we are going to see a MASSIVE MASSIVE RALLY. The Santa rally everyones is praying for. The wolfe wave RED line is the target. Also the channel resistance whch wasn't touched last time could be touched. 200 DMA also at the same place. 5300 coming and it will be very fast.


The EUR\USD is all set to rise. Because zerohedge says the shorts are at record highs.


So , its holiday time and volume will be low. So I will settle for a EPIC short sqeeze rahter than 1.20 on EUR/USD.And as world markets correlates 100% with  EUR/USD , the markets are going to EXPLODE higher.


Thursday, December 8, 2011

Wipro , GE SHIP, EVEREADY

I had noticed this nice Wolfe Wave on Wipro . I thought when NIFTY comes down a bit from that 5050 level , wipro will fall a bit tooand  I would post it as BUY . But this did not fall even today . Targets in the chart. Some people might wait for it to fall to 380-390 level and then buy . But cannot say anything about that .

===============================================================================================
Next stock is GE SHipping . With Oil going high and threat of a war in the ME, shipping cost too should increase. This stock has not one but 2 wolfe waves . But for the time being one might target the lower target area.

==============================================================================================

Eveready is already corrected to much lower levels. Now the support level lies very close at 24 while the stock is now trading at 26.30.
Like GE Shipping , 2 wolfe waves seen. This looks like a good buy at these levels.


Thanks.

Friday, December 2, 2011

Nifty --Short opportunity


==============================================================================================
The dollar is finding good resting place . I mentioned the parallel channel a few posts back.

Here is one very interesting chart. I have added the bollinger band in the daily chart for 34 period.
Everytime since nov 2010, when the markets came down hugely , it retraced for some days to touch the mid level bollinger band. These points are marked by down arrows. Then again it came down atleast 75% to touch the lower bollinger band. This time NIFTY has stopped exactly at the mid level bollinger band.


Lower Bollinger band currently stands at 4680 . That could be one of the target if we go down from here.

And then we have actually 2 GAPs to fill .


One gets filled at 4833 and other gets filled at 4730. I am waiting for a target of atleast 4830 on this down move . (But what do I know , markets can go straight up from here and I will end up with plenty of holes in my pocket)

The dollar just pricked the channel support line and then is UP substantially . So are the  US 30 year treasuries. If the dollar stays at the same place where it closed last friday , I expect Nifty to open at leats 50 points lower.

Wednesday, November 30, 2011

Potential HUGE INVERSE HnS in dollar

This is not the chart which one should look and trade the  short term markets . But it is definitely one of the picture one should keep in mind.  Is the dollar currently forming the RIGHT shoulder of what could be a POTENTIAL HUGE INVERSE Head and Shoulders in the dollar.

Currently unable to work with a good charting software. So marked the Shoulders and head with triangles. I think its clear  enough.


One of my earlier post showed a high enough target for a dollar rally.

http://markettechnicals-jonak.blogspot.com/2011/08/dollar-poised-for-massive-rally.html

Dollar HITS CHANNEL support

Some might remember the channel that I had pasted on this site. Well with the global liquidity swap by the central banks in full force, the dollar has hit the lower support of that channel. Tomorrow the nifty is sure to open GAP UP. Bu the I think it would be good to take rofits instantly , as long as the dollar is resting on that support line . Because that is a good support and the dollar might bounce from there . Which will again push the stocks down from their highs.

Monday, November 28, 2011

Nifty upmove ahead.

I have been looking like a HAWK at the dollar charts . Without a weakness in the dollar , Nifty WILL NOT RALLY .  The dollar has been going very strong .  But now its looking like a TOPPING pattern is emerging and a break of bothe the HnS neckline and the trend line support is due. And that wil  help the nifty travel higher from the cirrent levels. I am expecting a minimum target of 4960 . It may go higher than that  .


Thursday, November 24, 2011

Nifty --update:28-11-2011

So the 1st 2 targets have been achieved . Nifty looks like it is heading higher towards 4900. But at this point I see a good resistance at 4820. One might buy a small PUT . For a target of 4750.

Good BUYS

Just took a look at 2 stocks. One of them Appolo Tyres. I knew that it would go higher , when it broke that triangle with good volume.
But forgot to post earlier.


But I think it still has some steam to go higher. Target 70 on this one.


=============================================================================================

Next one is the Shiv Vani. Good bullish flag like formation . Target 238-240 above 215.


Saturday, November 19, 2011

Mphasis charts

Mphasis was looking bad. It has broken that rectangular pattern with HUGE volumes .


I was watching for sometime . It has now a very good chance of hitting 150 levels.

DEFTY divergence

Some divergence is seen . May be a nice pull back ahead.

Thursday, November 17, 2011

DOLLAR charts

We take a look at crucial dollar charts . The inverse relation of equities to the DOLLAR is almost 100%. The dollar has hit another POTENTIAL parallel channel resistance line . I expect it to move down from these levels . Also divergence in indicators seen.


The  level has been hitting for 3 times now.


You can see that the SnP just managed to break inside that TRIANGLE . That because of the last bearish candle in the previous chart .


I expect a down move in the dollar now. And that should take stocks higher from these levels

Sunday, November 13, 2011

Dollar in a channel.


Dollar has found a workable channel . I expect another move UP , if not to the previous High , but atleast to 77.83 area. Then it could form a DIAMOND patter . For the next move down . Lets see. If dollar goes up , NIFTY goes down . 

Thursday, November 10, 2011

DEFTY chart

We got this DEFTY CHART here. The DEFTY waves are more CLEAR than the NIFTY .  We can see  a good WOLFE WAVE in the DEFTY . Targets much lower than current levels. So this down move in NIFTY may not be over.


Monday, November 7, 2011

Nifty and Dollar

Sadly no charts atleast for now . But I am looking at live charts which cant be saved and uploaded here.
The dollar is swinging inside a channel which looks more like a BULL FLAG . It has hit the upper channel line 3 times. And the lower channel line 2 times. . All the more probability that dollar wil come down to hit the lower channel line which will take world markets higher. Nifty will target 5360. Dont know how high it may go.  But if the BULL FLAG interpretation is correct then you knwo what happens after BULL FLAG completes  ; DOLLAR rises and stocks go down . Bought some CALLs  today.

Have fun trading.

Wednesday, November 2, 2011

A few SHORT candidates.

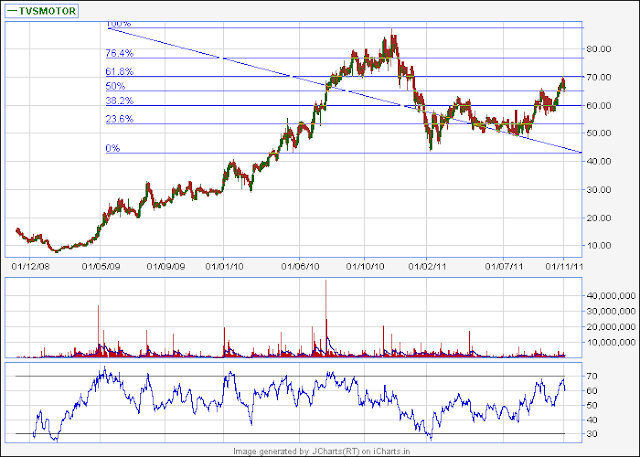
 TVS Motors chart .The first chart shows  exact retracement to golden ration 61.8%


The 2nd chart shows that the price is channeling  which could be interpreted as a BEAR FLAG .


We also have a wolfe wave target of around 55. .


Elliot wave wise we can say that B completed and C wave is starting now . the RSI is at overbought levels.  This one looks like a definite SELL at the present levels.
-------------------------------------------------------------------------------------------------------------------------------------------------------------------
PVR charts  below . Channeling and knocking at resistance levels  . Also can be said to be a BEAR FLAG .  Divergence seen .  Wolfe Wave targets below 100.


Mahindra & Mahindra . 5 waves looks completed. Wave 5 stops exactly at 161.8% of wave 1 .   Flat 2nd wave correction . diagonal triangle in the 4th . Elliot wave doesnt get better than this .

Tuesday, November 1, 2011

Nifty --a little bounce

Very short term oversold. Filled the bigger GAP . But we left a little GAP at the top which gets filled at 5327.
So expecting a bounce atleast till that level. Not shorting at these levels. Important FED meeting coming up . Better wait till tommorow . But many analyst on the blog are primarily BEARISH . They are expecting a bounce to complete a smaller HnS   and will also complete a right shoulder of larger HnS.


Monday, October 31, 2011

Nifty --Wolfe Wave

Seems like we will atleast revisit the recent highs...If not more. 4th wave of this C is done . Now one final 5th to complete the C and the X.


Look at a few stocks.

The volume action looks good for this one to be classified as a genuine double top. The stock should promptly return to 70 level.


TATA MOTORS --Nice Touch of the Broken  Trend line . Also 50% retrace of previous fall. Momentum LOSS. This one should be SELL.


This stock is forming a Symmetrical triangle . The thing here we are not sure which way the break out will occur. Its striking the Trend line . If it breaks the Trend line with HUGE volume , its a buy .  Just watch now. Break out should be very near


Sasken :::BEAR FLAG


REPRO ----  Double TOP  in this one .  Should come down to 130.


JUBILANT FOODWORKS.::-It had a very good ride . but now the charts look DEADLY BEARISH . HnS pattern can be seen with DROPPING NECKLINE . Though HnS is not confirmed  till now , its better to NOT HOLD  this one . It had found support in its long term Trend line .  it might not this time . This one is UGLY . This should target 350 levels. 


HeroMotors. --Double TOP. Bearish Reversal Candle at TOP.  What else do u need to make up your mind to sell.


HCL Tech . A classic RETEST of the TREND LINE . After the Head and Shoulders break down . Now a DARK CLOUD cover at overbought levels.


Gitanjali :--- people holding this one must be paying attention . though VOLUME action is not very clear , I still consider it as DOUBLE TOP . It has a higher chance of breaking the TREND LINE this time . Huge volume sell-off.


FORTIS :-- This one could be bought with a target of 144.


Canara Bank-- BEAR FLAG .


BEML should target 700. WolfeWAve target red line.


Saturday, October 29, 2011

Nifty--Fractal Forecast

Look at the Nifty daily chart and counts below.


I dont have 50 years of data with me . So i was just looking  for similar patterns and I found one. This is the Nifty from June  culminating with the MAURITIUS Collapse.


Thursday, October 27, 2011

Nifty channel and COUNT

Remember that channel. Will try to HIT that channel and close the GAP at 5330.


(c) completed . I have placed a W there. Now doing X which should be a 3 wave . Now doing C of X.
5338 is 38.2% retracement of W , i.e from 6338 to 4720. That 5330 has a confluence of FIBO resistances . So BULLS should be carefull.

5 waves need to be spotted in this one . Pink parallel channeling.


 Have to run to office . Will edit and post more info . I think shorts can still be held and dont square off at LOSS.