So ..are we doing that move towards 6200 from here or is there (little)more fall.....before we go for a rally...
in the post below i said we are doing a consolidation before we head for a Major 350 + pointer rally....I had shorted at 5950 level ..but this thing went some 80 odd points more than I thought.....Added more shorts at higher levels...
So look at the 2004 chart again....see the area which is underlined with red Horizontal bar...

And see a smaller fractal....the 1 minute chart from 21st sep when we saw a big 160+ point blast ....area marked between 2 horizontal bars....
.jpg)
So the NIFTY pathway that's on my mind is shown by BLUE lines...
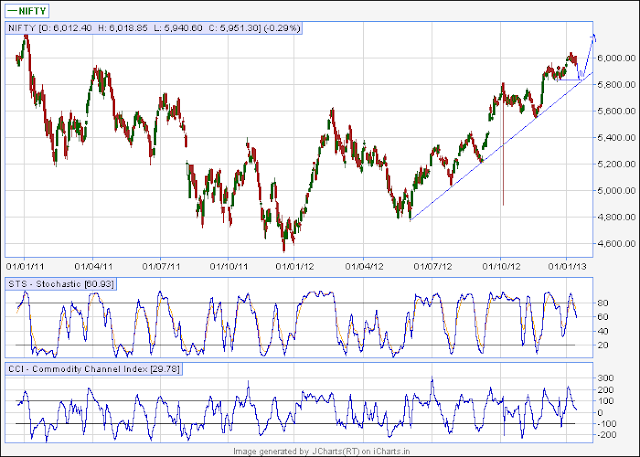
So that means more fall till 5840...and then we rally ....what do u think...lets see...
NIFTY 28-Jan-2013
ReplyDeleteCurrent Market Situation :
NIFTY current close : 6075
NIFTY resistance level : 6158
NIFTY support level : 5912
NIFTY sentiment : positive
NIFTY dominant cycle period : 19 days
Levels Tomorrow :
NIFTY intraday resistance 1 : 6100
NIFTY intraday resistance 2 : 6129
NIFTY intraday resistance 3 : 6172
NIFTY intraday support 1 : 6049
NIFTY intraday support 2 : 6020
NIFTY intraday support 3 : 5978
for more log onto
http://marketsquantified.blogspot.in
Thank you for your blog..this is very nice
ReplyDeleteRegadrs
Market Profile