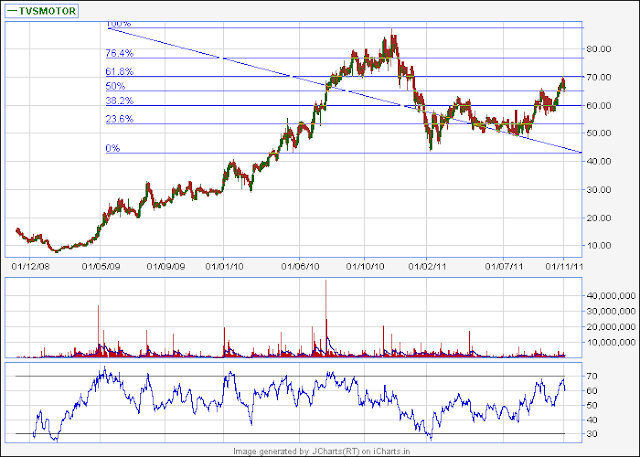
TVS Motors chart .The first chart shows exact retracement to golden ration 61.8%
The 2nd chart shows that the price is channeling which could be interpreted as a BEAR FLAG .
We also have a wolfe wave target of around 55. .
Elliot wave wise we can say that B completed and C wave is starting now . the RSI is at overbought levels. This one looks like a definite SELL at the present levels.
-------------------------------------------------------------------------------------------------------------------------------------------------------------------
PVR charts below . Channeling and knocking at resistance levels . Also can be said to be a BEAR FLAG . Divergence seen . Wolfe Wave targets below 100.
Mahindra & Mahindra . 5 waves looks completed. Wave 5 stops exactly at 161.8% of wave 1 . Flat 2nd wave correction . diagonal triangle in the 4th . Elliot wave doesnt get better than this .


No comments:
Post a Comment