Friday, January 27, 2012


Sunday, January 22, 2012
Tata Motors --Target 260
A nice Inverse HnS pattern completion giving a target of 260. Retest of the neckline is possible which should give good buying opportunity.


Tuesday, January 17, 2012
Nifty pause here??
I think NIFTY is going to touch 5130-70 area. . But right now there can be a pause or a down move. Not much though . May be 100 or 150 points maximum.
First the Nifty futures chart . Touching 50% retracement. Daily chart overbought. And touching Bollinger upper level.

Then there is AUD/USD chart. Daily chart almost hiting overhead resistance. Expecting some correction.

But as we can see from the NIFTY daily futures chart above , we have good support at 4890 and then massive support at 4820. I will be targeting only 4890 in this little SHORT , in a day or 2.
First the Nifty futures chart . Touching 50% retracement. Daily chart overbought. And touching Bollinger upper level.

Then there is AUD/USD chart. Daily chart almost hiting overhead resistance. Expecting some correction.

But as we can see from the NIFTY daily futures chart above , we have good support at 4890 and then massive support at 4820. I will be targeting only 4890 in this little SHORT , in a day or 2.
Friday, January 13, 2012
Nifty bullish momentum.
Weekly chart shows oversold indicators with divergence.

Daily chart . The major pattern working here is the failling wedge which is a bullish pattern mainly. We have broken out of the wedge with increase in volume . Also broken out of the triangle. For the past couple of sessions , Nifty has been consolidating above 4800. Since 4800 was the breakout level, I dont think Nifty will come down below it in a hurry. Even if it does by a few points I will not be worried because there are good supports below it. Target for this rally should be that RED WOLFE WAVE line . We shouldbe reaching that by March midweek may be. Atleast 5400 is on the cards here. But one step at a time . First target is 5070-5170 region . Where we have seen resistance before.


Daily chart . The major pattern working here is the failling wedge which is a bullish pattern mainly. We have broken out of the wedge with increase in volume . Also broken out of the triangle. For the past couple of sessions , Nifty has been consolidating above 4800. Since 4800 was the breakout level, I dont think Nifty will come down below it in a hurry. Even if it does by a few points I will not be worried because there are good supports below it. Target for this rally should be that RED WOLFE WAVE line . We shouldbe reaching that by March midweek may be. Atleast 5400 is on the cards here. But one step at a time . First target is 5070-5170 region . Where we have seen resistance before.

Sunday, January 8, 2012
Nifty and AUD/USD charts ( updated charts and Views)
Jan 10 ::----Bears still have hopes . Nifty futures resisted at the trend line . Also thats exactly 50% retracement. Bollinger bands are also touched. Pattern of a falling wedge . But 1 more wave down looks more possible to complete a 5 wave down move.

And the carry AUD/USD pair chart . That risen very high and so we are seeing this rally. But the hourly RSI is overbought . Also touched important resistance line.

I am at a loss position in my SHORTS. But i will be holding till this FRIDAY. Atleast 4690 should be touched again if not lower.
======================================================================================================
My best guess . Nifty is doing the TRIANGLE as shown below . So i will target 4640 first.

To support my bearishness , AUD /USD pair has broken important trend line support and should be going down for a couple of sessions more. Also moving in a down ward channel.


And the carry AUD/USD pair chart . That risen very high and so we are seeing this rally. But the hourly RSI is overbought . Also touched important resistance line.

I am at a loss position in my SHORTS. But i will be holding till this FRIDAY. Atleast 4690 should be touched again if not lower.
======================================================================================================
My best guess . Nifty is doing the TRIANGLE as shown below . So i will target 4640 first.

To support my bearishness , AUD /USD pair has broken important trend line support and should be going down for a couple of sessions more. Also moving in a down ward channel.

A few stock charts
Click on the charts for commentary.
APPOLO TYRES.


FACT


INFOSYS

ITC TERMINATION PATTERN?

JUBILANT FOODS IN SAME DIAMOND PATTERN


APPOLO TYRES.

CIPLA

FACT

GITANJALI

INFOSYS

ITC TERMINATION PATTERN?

JUBILANT FOODS IN SAME DIAMOND PATTERN

RAYMOND.

WIPRO LOOKS GOOD.

Thursday, January 5, 2012
AUD/USD charts --support line
AUD /USD updated charts . Major support.

======================================================================================================
Markets correlating more than 90% with the AUD/USD pair . It has broken down from its highs. Chart below shows the support lines. Now in a triangle which most probably will turn out to be a contuation pattern . So more downsides on the way . But supports are seen at 1.023 and 1.020.


======================================================================================================
Markets correlating more than 90% with the AUD/USD pair . It has broken down from its highs. Chart below shows the support lines. Now in a triangle which most probably will turn out to be a contuation pattern . So more downsides on the way . But supports are seen at 1.023 and 1.020.

Monday, December 26, 2011
Nifty trade--The PLAN( update --5th Jan---Change of PLANs)
UPDATE :::3:30 PM -------SQUARE OFF ALL LONGS. AUD/USD has broken down . Next week we will see down move. Going SHORT . Next week we might revisit 4520 area agin.
======================================================================================================
Update -5th Jan .
Hi everyone .
The markets is not as strong as I would have liked . The wolfe wave target shown by PINK LINE given in the chart below should be met . But the question is HOW. It looks like we will go down first and then go for a rally . As we can see in the chart below , the upper level of BOLLINGER band has come down .Nifty wont cross that level without coming down . Both that level and the downward resistance line are showng that at most nifty can travel is 4850 area. We should be trying to reach that target , by tomorrow.
At which point we might GO SHORT .

=======================================================================================================
Nifty Plan update --2 Jan-2012
Weekly CHART below . Two good indicators the CCI(8) and stochastic(5) are in oversold zone. Dont see huge sell-off at this moment. Nifty has corrected around 90 more points than I expected. The WOLFE WAVE line intersects the down trend resistance line at around 5280...So I think thats the maximum the Nifty can go . Also Nifty has around 8 more trading days left to touch that . Lets see what the market does. Last year all the gains came in the 1st fortnight of January. After that Nifty has been crashing in SLOW MOTION. Also COMMERCIALS are NET LONG the EURO hugely . Seeing a squeeze there.
Another important thing is that January 10-11 is roughly 34 month from the MARCH 2009 low. So that should be significant time around there. So lets hold on to the CALLs till that time or atleast till this week.

=============================================================================================
Update(28 dec--2:pm):-----Nifty should touch 4685 area. There we BUY January CALLs for a 1st target of 4930-4940.
=============================================================================================
I still believe we are going a lot higher than the current levels as I forecasted::---
http://markettechnicals-jonak.blogspot.com/2011/12/nifty-update.html
From pattern and symmetry it looks like we rally for 16 TRADING DAYS. I will post more on that later. Now 4820-4830 is very good resistance . I expect Nifty to take a pause there. So we should see that level by tomorrow . Where I would SQUARE OFF the longs. Then I should take a small SHORT POSITION . I am thinking of a downmove to 4720 . And thereafter no more DECEMBER CONTRACTS. Expiry is very near. By Thursday or Friday , I should be going LONG JANUARY contracts.

Happy Trading.
======================================================================================================
Update -5th Jan .
Hi everyone .
The markets is not as strong as I would have liked . The wolfe wave target shown by PINK LINE given in the chart below should be met . But the question is HOW. It looks like we will go down first and then go for a rally . As we can see in the chart below , the upper level of BOLLINGER band has come down .Nifty wont cross that level without coming down . Both that level and the downward resistance line are showng that at most nifty can travel is 4850 area. We should be trying to reach that target , by tomorrow.
At which point we might GO SHORT .

=======================================================================================================
Nifty Plan update --2 Jan-2012
Weekly CHART below . Two good indicators the CCI(8) and stochastic(5) are in oversold zone. Dont see huge sell-off at this moment. Nifty has corrected around 90 more points than I expected. The WOLFE WAVE line intersects the down trend resistance line at around 5280...So I think thats the maximum the Nifty can go . Also Nifty has around 8 more trading days left to touch that . Lets see what the market does. Last year all the gains came in the 1st fortnight of January. After that Nifty has been crashing in SLOW MOTION. Also COMMERCIALS are NET LONG the EURO hugely . Seeing a squeeze there.
Another important thing is that January 10-11 is roughly 34 month from the MARCH 2009 low. So that should be significant time around there. So lets hold on to the CALLs till that time or atleast till this week.

=============================================================================================
Update(28 dec--2:pm):-----Nifty should touch 4685 area. There we BUY January CALLs for a 1st target of 4930-4940.
=============================================================================================
I still believe we are going a lot higher than the current levels as I forecasted::---
http://markettechnicals-jonak.blogspot.com/2011/12/nifty-update.html
From pattern and symmetry it looks like we rally for 16 TRADING DAYS. I will post more on that later. Now 4820-4830 is very good resistance . I expect Nifty to take a pause there. So we should see that level by tomorrow . Where I would SQUARE OFF the longs. Then I should take a small SHORT POSITION . I am thinking of a downmove to 4720 . And thereafter no more DECEMBER CONTRACTS. Expiry is very near. By Thursday or Friday , I should be going LONG JANUARY contracts.

Happy Trading.
Tuesday, December 20, 2011
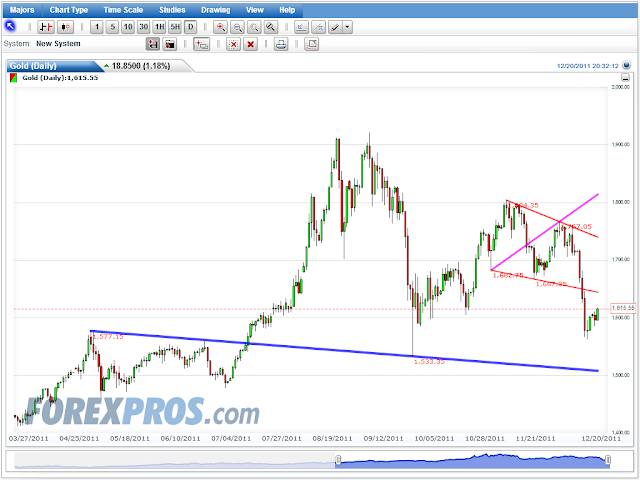
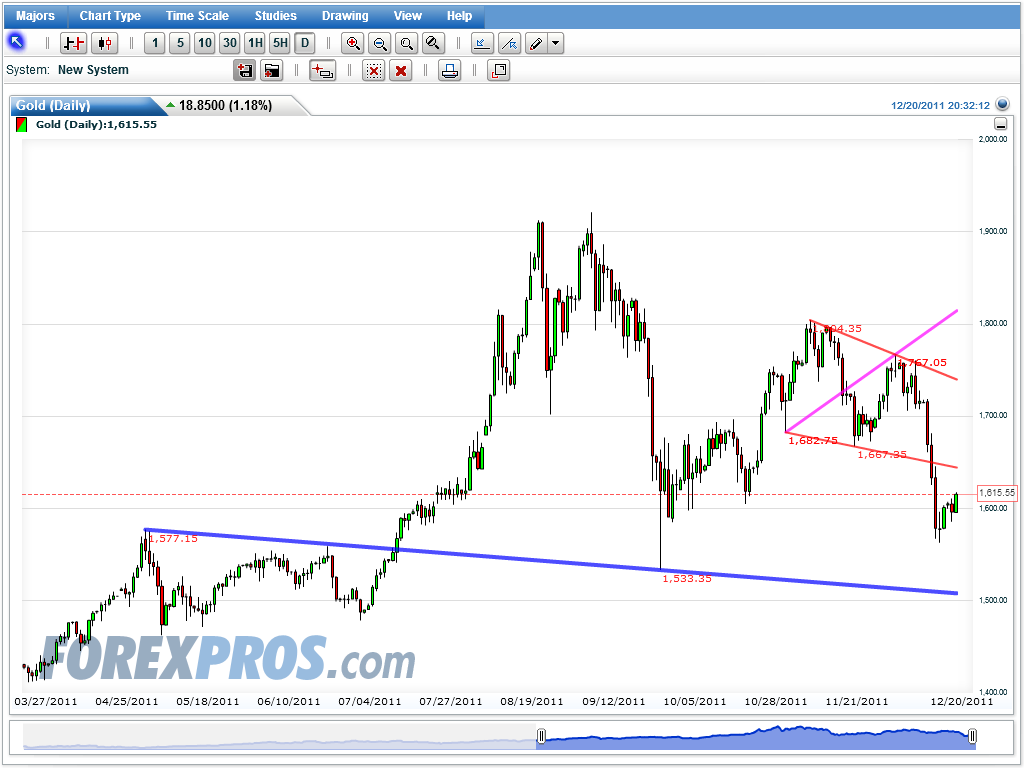
GOLD targets higher.
Check that PINK Wolfe Wave target line in GOLD showing a target of atleast 1900 dollars. This surely is one of the few good buy opportunity.
Wednesday, December 14, 2011
Nifty ::Massive rally ahead
4650 area was the target i was looking for . Looks like the FALL is going to end on Monday, after breaking 4600. Target for me is 4570.
http://markettechnicals-jonak.blogspot.com/2011/12/nifty-short-opportunity.html
But after that we are going to see a MASSIVE MASSIVE RALLY. The Santa rally everyones is praying for. The wolfe wave RED line is the target. Also the channel resistance whch wasn't touched last time could be touched. 200 DMA also at the same place. 5300 coming and it will be very fast.

http://markettechnicals-jonak.blogspot.com/2011/12/nifty-short-opportunity.html
But after that we are going to see a MASSIVE MASSIVE RALLY. The Santa rally everyones is praying for. The wolfe wave RED line is the target. Also the channel resistance whch wasn't touched last time could be touched. 200 DMA also at the same place. 5300 coming and it will be very fast.

The EUR\USD is all set to rise. Because zerohedge says the shorts are at record highs.
So , its holiday time and volume will be low. So I will settle for a EPIC short sqeeze rahter than 1.20 on EUR/USD.And as world markets correlates 100% with EUR/USD , the markets are going to EXPLODE higher.
Subscribe to:
Posts (Atom)